GSX Gizmo Boston 2.0.0

Release Notes - Version 2.0 October 30th, 2020
New Features
Web Application
Role-Based Access Control CLOUD ON-PREMISES
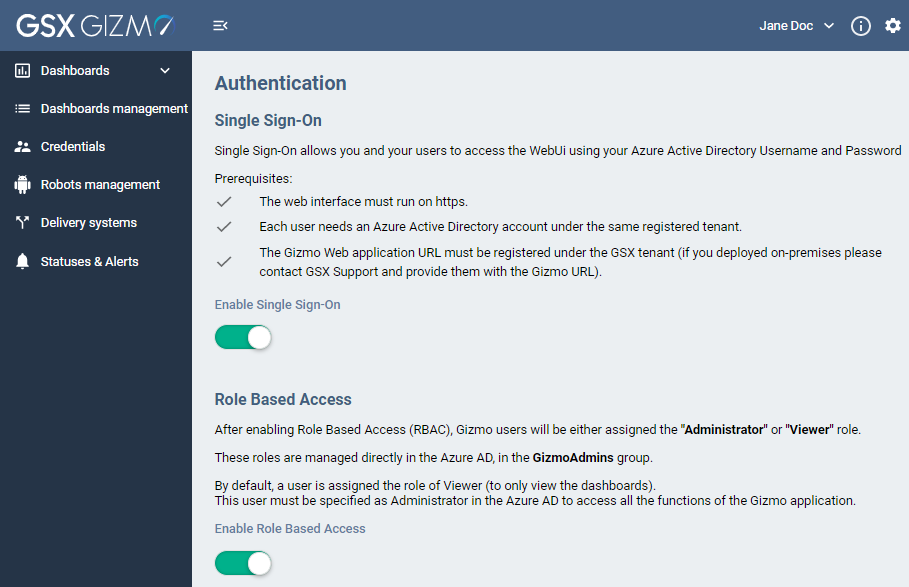

Role-Based Access Control (RBAC) is a feature allowing users to access the application depending on their role: Administrator or Viewer. By default, a user is assigned the role of Viewer (to only view the dashboards). This user must be specified as Administrator in the Azure AD to access all the functions of the Gizmo application.
Status / Alerts management view CLOUD ON-PREMISES
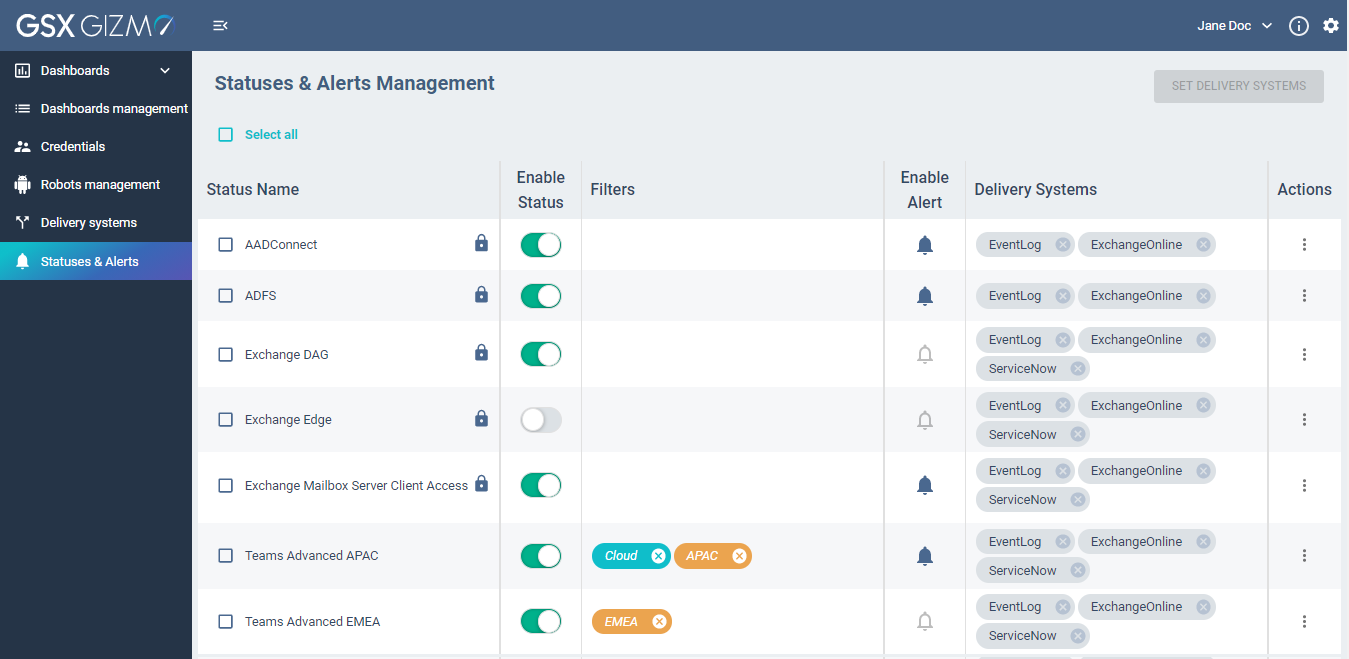
You can see in a same view statuses and alerts, with the ability of enabling/disabling them. Note that an alert cannot be deactivated while its status is disabled.
A status is associated to several alerts that correspond to thresholds.
When disabling a status, the corresponding card in dashboards will remain with the last status until the user refresh the page or change the displayed dashboard. The time since last status calculation will be updated regularly (every 3 minutes). After a refresh, the card will be displayed in grey, showing that the status is disabled. As the status is disabled, there won’t be any more alert sent.
You can duplicate statuses, this action is also duplicating the attached Delivery systems.
You can remove Custom statuses, note that a message will prompt you to confirm your choice.
You can edit the name and thresholds of a status using the edition mode. You can also use a filter with tags.
Robots management view CLOUD ON-PREMISES
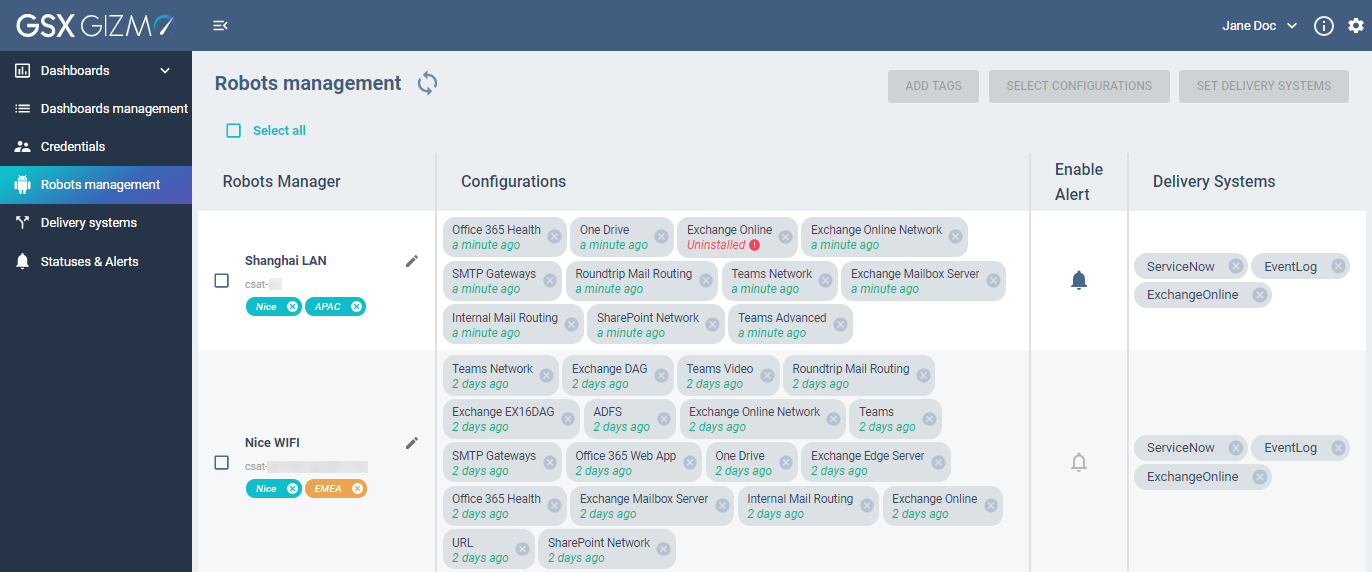
The Robots management page allows you to receive alerts from Robot Managers. These alerts are based on the health of the configurations and are sent through delivery systems.
It is possible to edit the Robot manager’s name.
Alerts are now aggregated at the level of the Robot Manager which allows to receive only one alert instead of several related to the same issue.
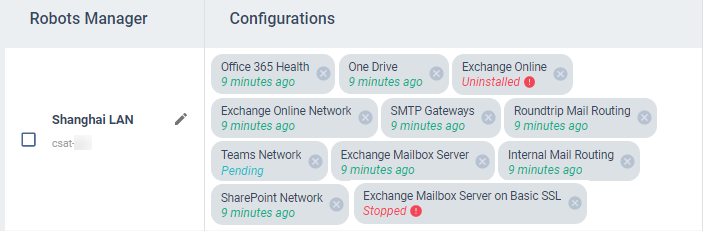
Robot Health monitoring: you can now easily visualize an error message when robots are not scanning as expected.
Dashboards viewCLOUD ON-PREMISES
This is the view mode.
An edition mode allows you to edit custom dashboards in order to add, remove, resize or move cards.
Dashboards management view CLOUD ON-PREMISES
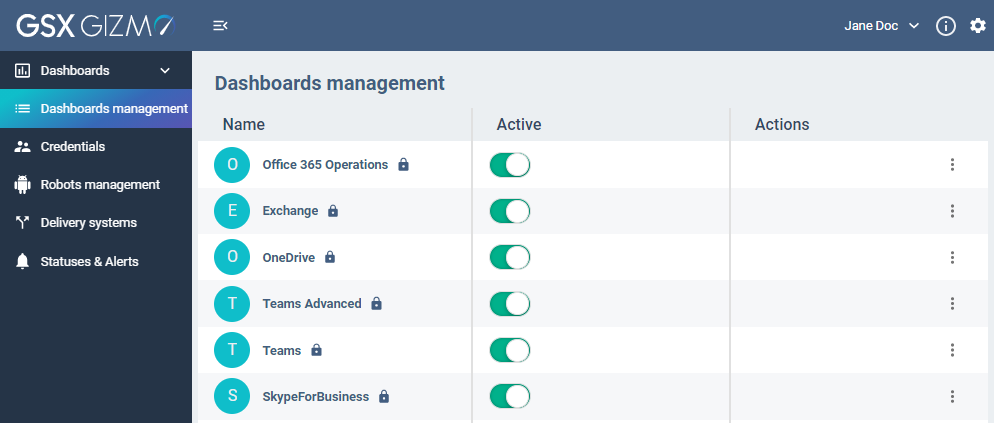
Dashboards management view allows you to see all the dashboards on the same page and to identify system and custom dashboards. Actions possible are the following:
Create a custom dashboard
Duplicate a dashboard
Delete a custom dashboard
Enable / disable (to hide it in the menu) a dashboard
Rename a custom dashboard
Workload
Exchange DAG monitoring CLOUD ON-PREMISES
It is now possible to monitor the health of your Database Availability Groups (DAGs) inside your Exchange On-premises organization. Ensuring the high availability is provided and the replication of every single database is healthy.
Power BI
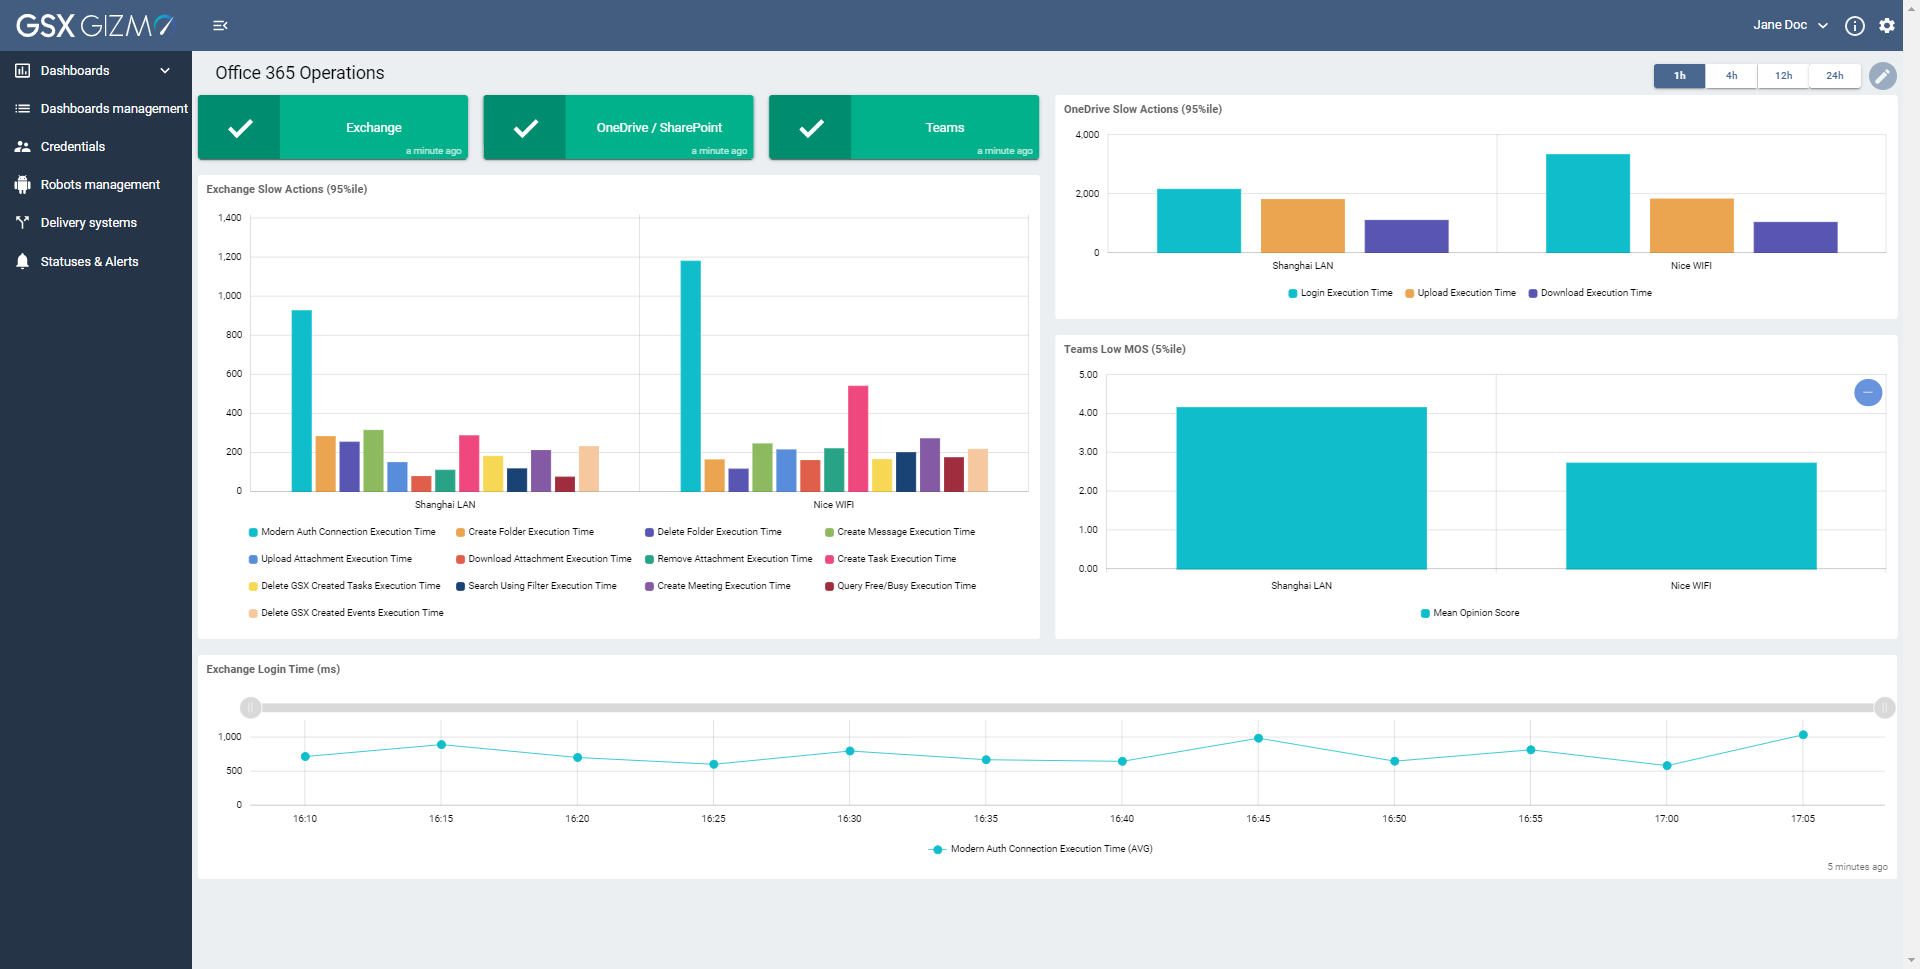
Office 365 monitoring CLOUD ON-PREMISES
You can easily have a visibility on all critical web applications within Office 365, essential to business operations.
Teams Video monitoring CLOUD ON-PREMISES
You can test Video and Screen sharing features in Teams in order to detect any impact that might cause issues.
Technical
Web API
Gizmo API can now be exposed on-demand (and based on licensing) in order to connect to third-party products.
Fixed Issues
All items below apply to CLOUD and ON-PREMISES environments.
Web application
The user interface is now working correctly after displaying the same dashboard for a while (at least 24 hours).
The log out button does not cause unexpected behaviors anymore on the user interface.
Remote font fetching were causing slowdown when using a proxy.
Exchange Mailbox Servers dashboards are now loading correctly.
In the Robot management view, the “+” and “x” buttons are now more visible.
In a certain case, version number was not displayed.
When loading a dashboard, some cards were not refreshed with a “Could not connect to the server” message error.
Dashboards duplication status is now consistent.
The actions of duplicating then updating a dashboard are now working correctly.
When enabling the RBAC, the expired login no longer causes errors.
Alerts
Disks alerts are now fully compatible with ServiceNow incidents.
Sending alerts to ServiceNow through a proxy server can now be configured properly from the Web Interface.
When a Robot used to calculate a status in a group is removed, the alert ticket is now closed.
Exchange Mailbox Server
Routing parser now parses correctly Header from messageLabs.
Exchange performance counters status are now testing “greater or equal to” as expected.
Custom Windows Services can now be monitored.
Preprocessing
When configuring a string property longer than 255 characters, the message processing is now displayed correctly.
The service is now listening to RMQ after a channel closing exception.
Other
ADFS Authentication: Passive mode authentication in EWS Scan component is now supported.
Web API: A status communication issue has been fixed.
Proxy configuration: Passed in proxy configuration is now used by all the requests made by Teams scan component.
Power BI: Power BI performances have been improved for large deployments.
Upgrade: Robot manager was not starting correctly after an upgrade.
RBAC: It is now possible to be part of more than 6 groups in the Azure AD.
Known Limitations and Known Bugs
Web Application
There must be only one tag Location per Robot Manager to make sure that the Power BI report will display all the data.
In the Robots management page, you might see some inconsistency if you Add or Remove a Scan Configuration from the GSX Management Shell.
By example, if you’re on the Robots management page, and in parallel you add a new scan configuration, you won’t see it in the Select Configurations. In order to see it you will have to pressF5in your browser, in the Robots Management page and Select Configurations again, then the Scan Configuration that you just created will be shown.Once you installed a Robot Manager, you might see on the Robots management page those icons for the Enable Alert and Delivery Systems columns. To fix it, you just need to click on the refresh icon at least 2 minutes after the installation of the Robot Manager.
The language parameter in the
appsettings.jsonfile must not be modified, we should keep it inenbecause modifying it will make the Web UI crashing with a blank page.In any status card, if you observe a value for the last scan date that is highly exceeding the scan frequency (e.g if your scan frequency is 5 minutes and you see in the status card 8 days ago), it may mean that all the robots linked to this status have been manually deleted but the status card keeps the latest known status. Or that the license has expired.
All system dashboards (dashboards that come by default with the Gizmo installation) can be replaced by a new version when doing an upgrade. So if a user made some changes in a system dashboard, he can loose all of them after an upgrade. Changes done to a custom dashboard are not lost. In this new version, system dashboards cannot be edited so, this problem won’t occur anymore.
Workload
If there is an issue with an Exchange Server and that the protocol set in the scan configuration is not the right one; when creating the PowerShell session, it could last for a very long time (hours).
The PowerShell process is stuck and the PowerShell commandNew-PSSessionis never reaching its default timeout (3 minutes).
So if you see an Exchange DAG not being scanned for a long time, you will have to:Try to create a
PSSessiononto the server that you are targeting, and see if the creation of thePSSessionis stuck. If it’s the case, follow the instructions below:Kill the Exchange DAG Robot process.
Set the scan configuration with the right authentication protocol.
The robot should be running properly.
When deploying AAD Connect on a Windows Server 2016, we can face the following issue: “No match was found for the specified search criteria for the provider 'nuget'. The package provider requires 'PackageManagement' and 'Provider' tags. Please check if the specified package has the tags”.
This can be solved by running the following command, in a PowerShell console with Administrator rights, on the machine where the Robot is deployed:
[Net.ServicePointManager]::SecurityProtocol = [Net.SecurityProtocolType]::Tls12

if (-not (Get-Module -ListAvailable -Name MSOnline))
{
    Install-PackageProvider nuget -Force
    Find-Module -Name MSOnline | Install-Module -Force -Confirm:$false
}
Web Application can display the message “Failed to retrieve the view“ on some cards when no app is deployed. This message will disappear once the template is deployed and returns results.
When deploying Exchange Edge Server template, in order to create the remote PS Session, you need to add the Edge server to your trusted host on the Robot Manager side:
Set-Item wsman:\localhost\Client\TrustedHosts -Value '<fqdn>' -Force -Confirm:$false
Technical
When upgrading the Gizmo product from the 1.9.0 to the 2.0.0, the IIS configuration might be reset to its initial state. This means that if you had configured HTTPS with a certificate on IIS, those settings will be set to the default value, without HTTPS. At this point, you won’t be able to access the Web UI with SSO. To fix it, you need to enable HTTPS.
When executing the validation script, you might face the following error:
# INSTALLER LOGS CHECK FOR POWERSHELL ISSUES
One or more PowerShell exceptions found in the following file(s):
- C:\Users<username>\AppData\Local\Temp\Install_GSX_Gizmo_1.10.0.10417_20201013092236_Installer_Logs\GSX_Gizmo_1.10.0.10417_20201013092236_017_WebUI.msi.log
This is the error found in the WebUI.msi.log file:
Trying to reach localhost...
Failed to reach the Web UI because of this error: The remote server returned an error: (500) Internal Server Error.
This behavior is due to the fact that one of the scripts in the installer is trying to reach the localhost, but the Web component is not completely set at this time. This issue can be ignored as far as the Web UI is reachable after the installation of the product.A local user profile must be used when installing the product and not a roaming profile.
When installing or upgrading the product, a Restart is asked at the end of the upgrade.
Sometimes, clicking on the Restart button is only closing the Installer interface, so you will have to manually reboot the machine if you need to.During the installation of the product, you might see, one or multiple times, a pop-up appearing asking for an executable file. You can press the Cancel button and the installation will be resumed.
When upgrading the product, you might see the following error:
“Files in use
The following applications are using files that need to be updated by this setup.
Click ‘Ignore’ to continue setup (reboot may be required).
Click ‘Abort’ to abort setup. Click 'Shut down' to close the applications.
Windows PowerShell”
To fix this issue, we need to close all PowerShell consoles and click Ignore.When upgrading the Gizmo version from 1.8.x or 1.9.0 to 2.0, the Username parameter in the scan configurations for the following workloads
Exchange DAG,Exchange Edge ServerandExchange Mailbox Serverhas to be updated if it contains a backslash \ character.After the installation or the upgrade of the product, if you used the Windows Authentication for the Database Connection during the product installation, the Validation Script will warn you about an issue found in the WebUI.msi.log file:
”# INSTALLER LOGS CHECK FOR POWERSHELL ISSUES
One or more PowerShell exceptions found in the following file(s):
- C:\FakePath\GSX_Gizmo_<version>.<build_number>_<date>_016_WebUI.msi.log”
This is due to a Web UI script in the installer that is not taking into account the Windows authentication, but there is no impact at all on the installation of the product.Scan Configuration CmdLet does not display Scan Configuration parameters when it contains an array of nested list objects. For example, when getting parameters from a Scan Configuration by running the
Get-GsxScanConfigurationcmdlet, we can see that the values of the array are empty, but actually there are values. However, there is a workaround which can be applied:Get the list you are interested in:
$ChecksWhereToIgnoreDatabases = $Params.ChecksWhereToIgnoreDatabases
To see the list of
ChecksWhereToIgnoreDatabases, you have to use the -join operator:$ChecksWhereToIgnoreDatabases -Join "`n"
Updating Delivery Systems must be done through the Web UI.
Do not use theSet-GsxAlertOutputRoutecmdlet, because it may block the Web UI with the message:Error while retrieving deliverys systemsDue to the complete change of behavior of the Status calculation microservices, all tickets opened before the upgrade won’t be updated anymore. In case emails have been sent for ticket opening (or other delivery system like ServiceNow), the user won’t receive a closing ticket email.
When upgrading from 1.8.x/1.9.0 to 2.0, make sure that you closed any shell that could have loaded the CmdLets (GSX Management Shell, PowerShell, Visual Studio Code …) that can cause this error:
Failed executing command "C:\Windows\system32\Windows PowerShell\v1.0\powershell.exe" -Command "& 'C:\Program Files\GSX Solutions\PowerShell\Installer.GsxManagementShell\CopyDependencies.ps1'". To fix it, just close the shell that could have loaded the CmdLets, click onRetryand the installation will be resumed.When installing the product from scratch, an issue can occur when validating the RabbitMQ connection:
”Could not load file or assembly 'RabbitMQ.Client, Version=5.0.0.0, Culture=neutral, PublicKeyToken=89e7d7c5feba84ce' or one of its dependencies. The system cannot find the file specified.”
To fix this issue, you need to close the installer and execute it again.When upgrading from 1.8.x/1.9.0 to 2.0, a restart is asked at the end of the upgrade.
It is not recommended to restart as it can cause a side effect where the Robot Managers are not up to date with all the dependencies required for several minutes. This causes some scans to not be performed because of the missing dependencies. The root cause is because the Robot Manager service is started before IIS after a restart, so the Robot Manager could not download the dependencies.When installing the product on a Windows Server 2019, Installer Logs files might not be zipped in the Installer Logs folder (this folder is located here:
%ProgramData%\Gsx Solutions\Installer Logs).
If it’s the case, the logs can be found in the temp folder by running the following command:explorer $env:TEMP.
The log files are prefixed with:GSX_Gizmo_<product_version>_<date_and_time>_<msi_to_install>.logGizmo installer executable must be launched with Administrator rights if we need to retrieve the existing IIS App Pools and Sites.
Passwords set for existing RabbitMQ and existing SQL database should not start with dash or contain special characters like: slash, back-slash, quote, back-quote, double-quote, space+dash, space+dollar.
Notice that the local installation will generate a password only with letters and numbers.Installation packages.On-premises users have regional settings with comma (,) as a number decimal separator.
This causes errors while inserting data in the historical table. The workaround is to force the English regional settings to have a point (.) as the default number decimal separator. A HotFix is available to allow Gizmo product to work with any culture.
Power BI
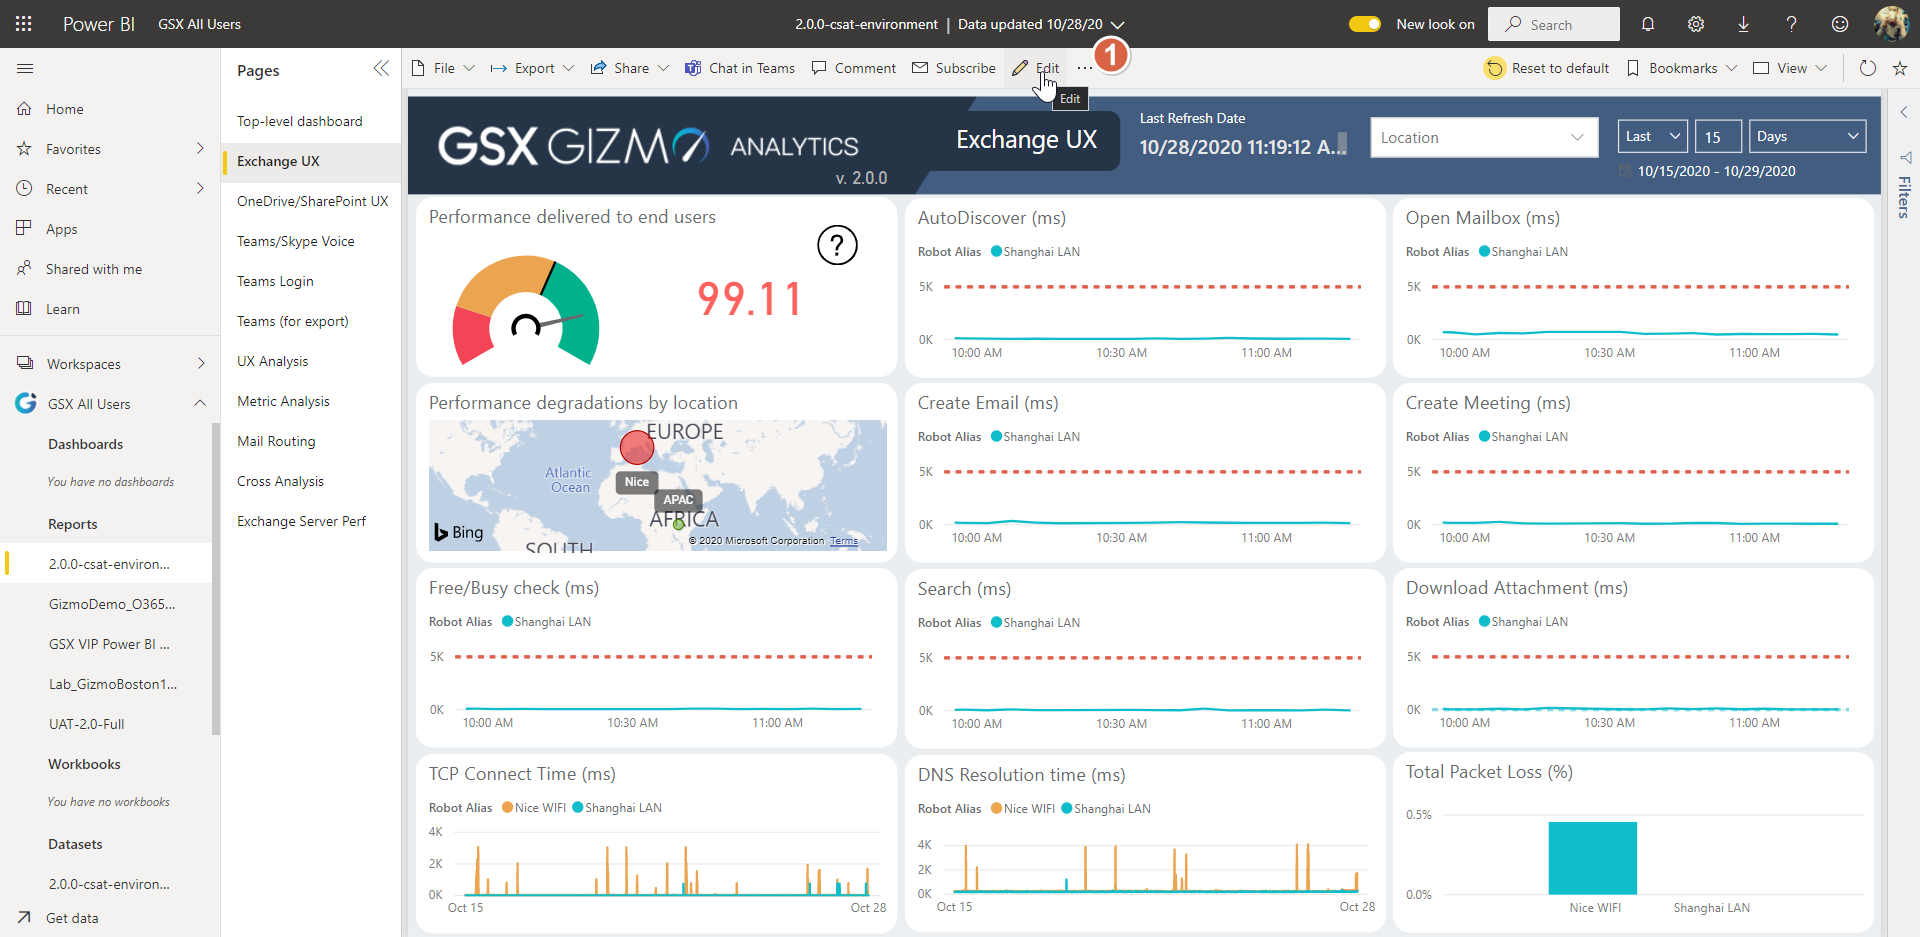
On all the pages of the Power BI report 2.0.0 and prior, there is an area where you can’t see the details of the graphs and other components when hovering them.
Below you can see the greyed out area that overlays the graphs and other components and won’t allow the user to see the values, and instead there will only be the hand cursor:
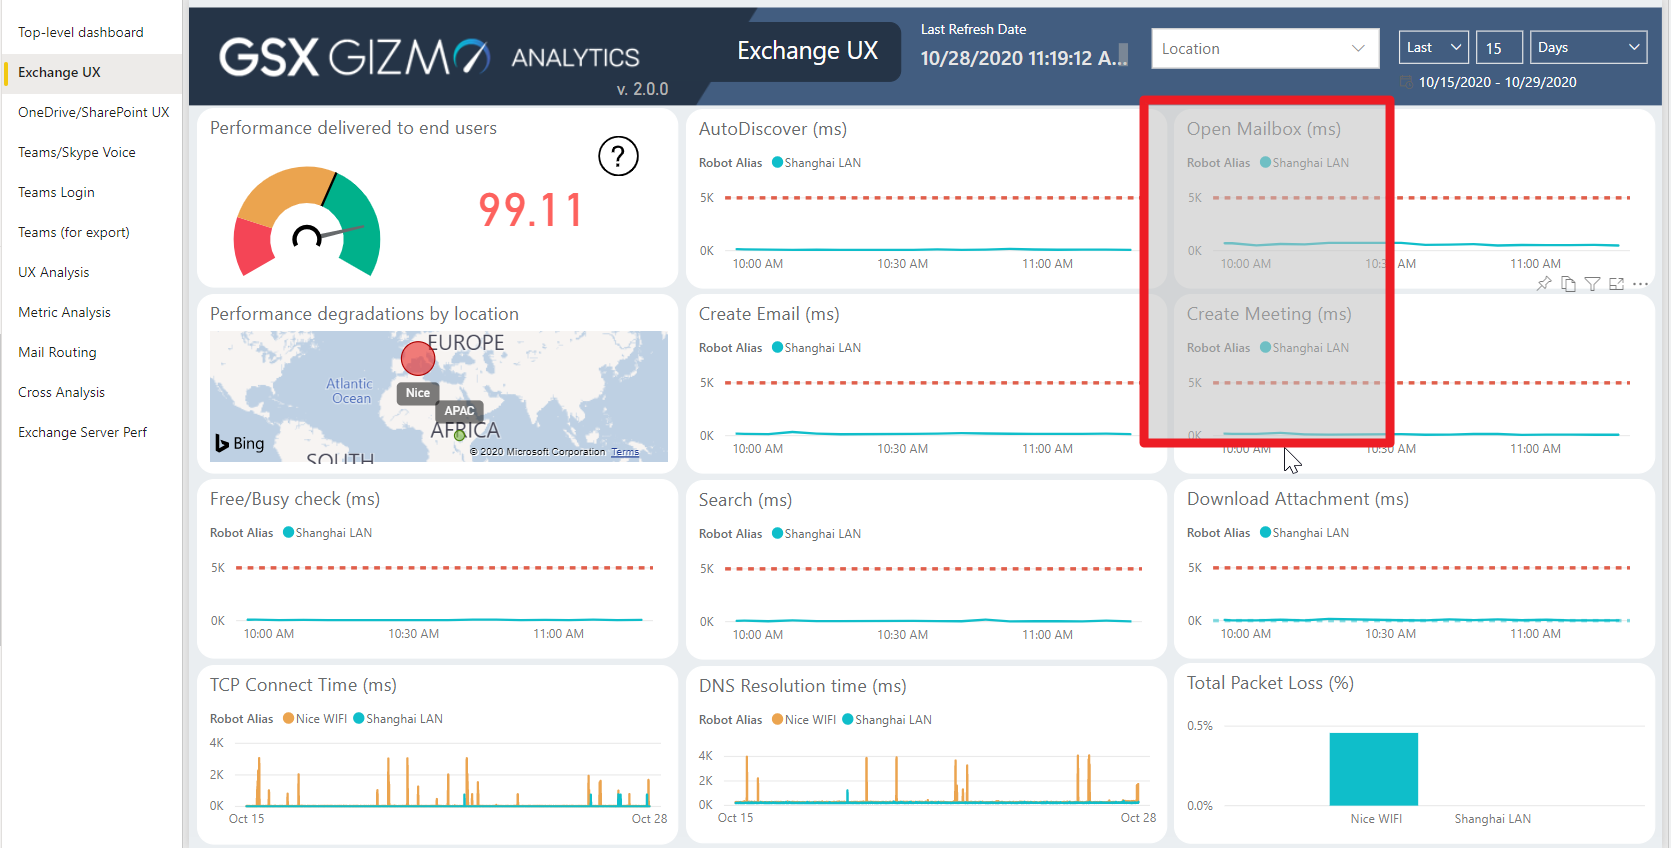
Instead of displaying the values, it will only display the hand cursor, as we can see below
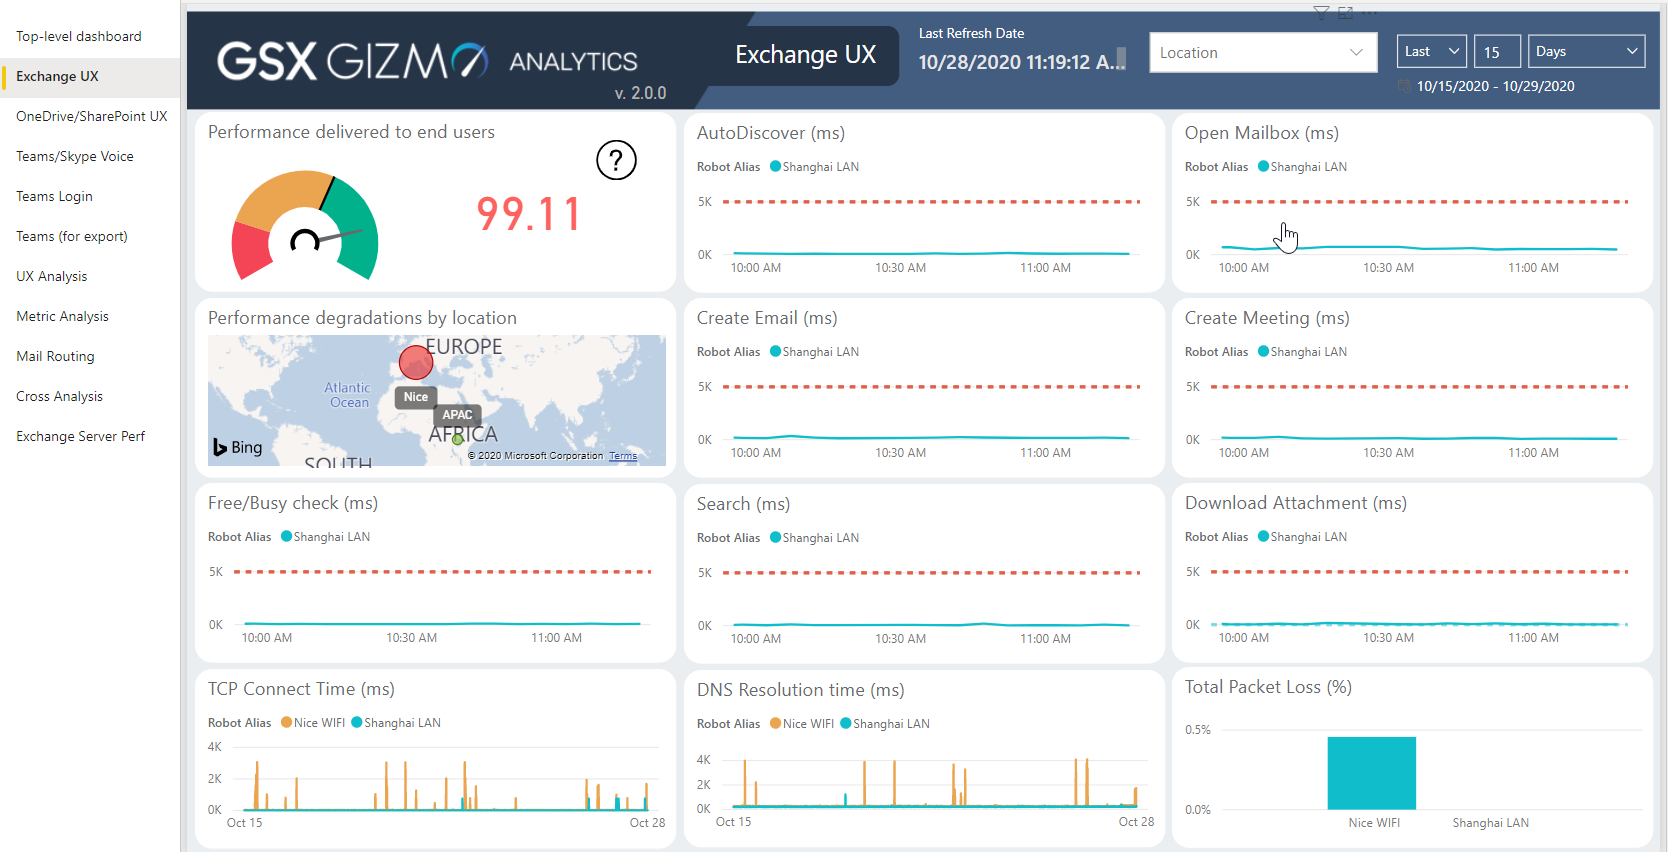
To fix, you need to follow those steps in Power BI service, for each page:
Click on Edit in Power BI.
Resize the Location element.
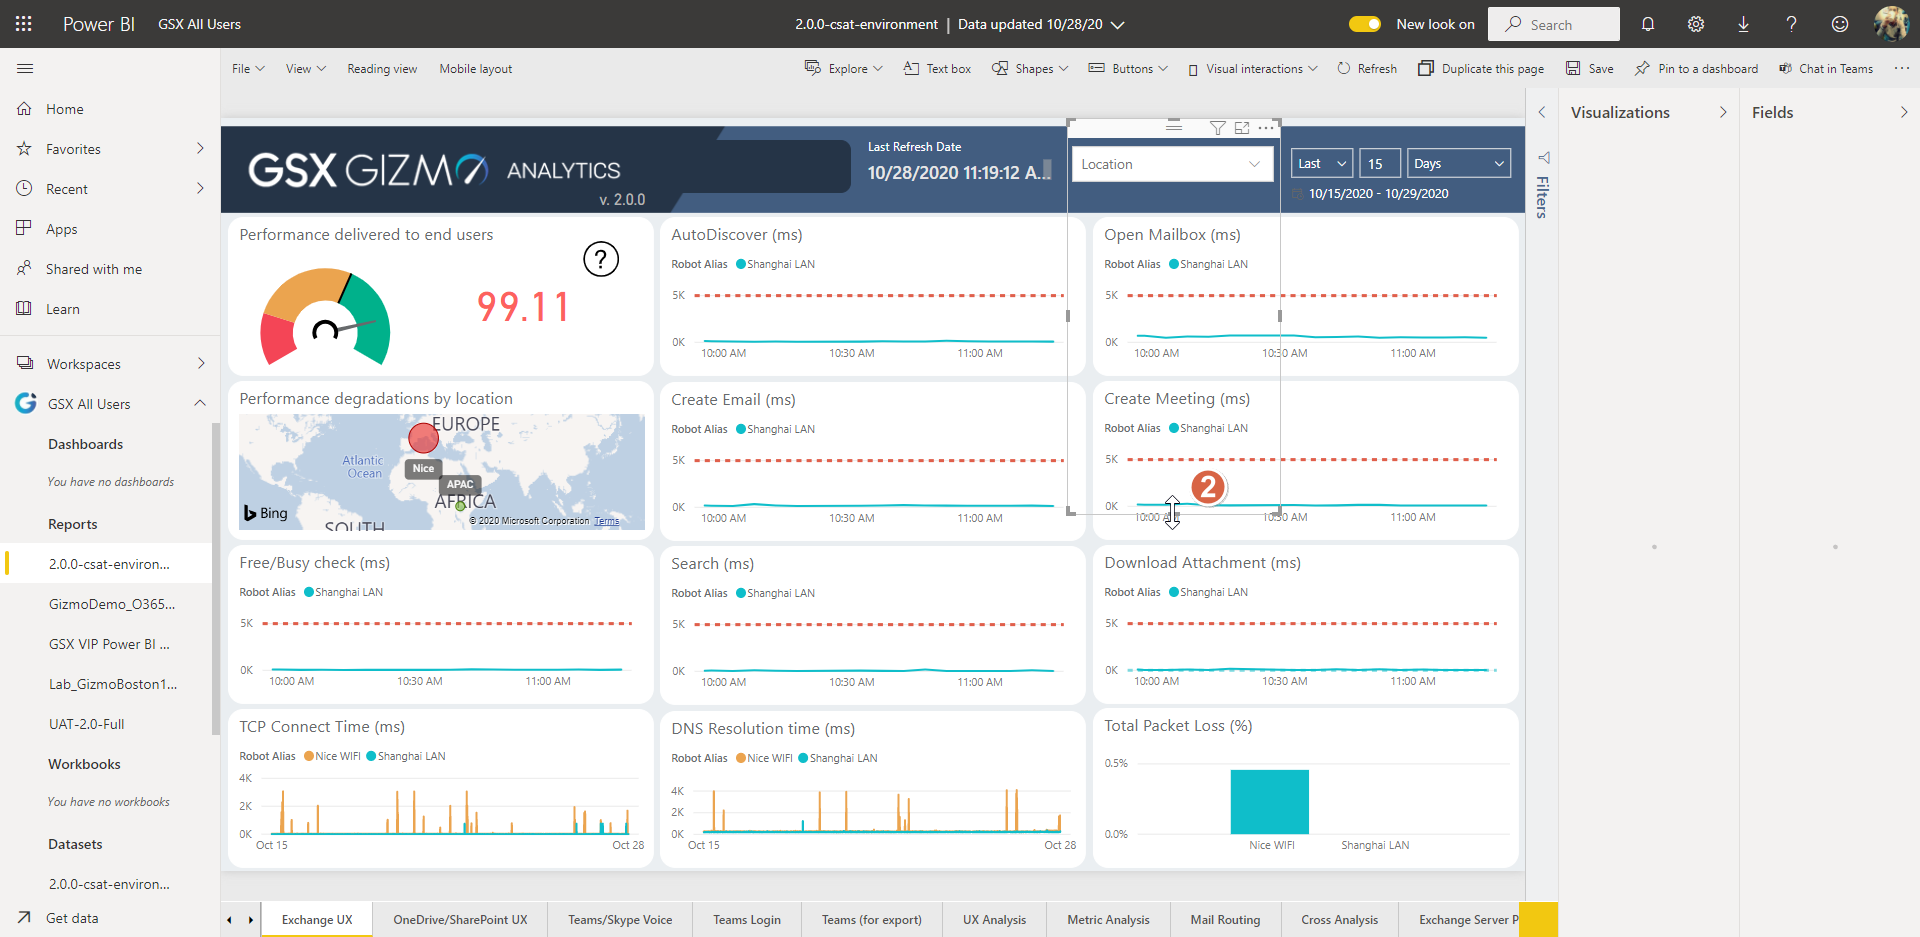
To be this size.
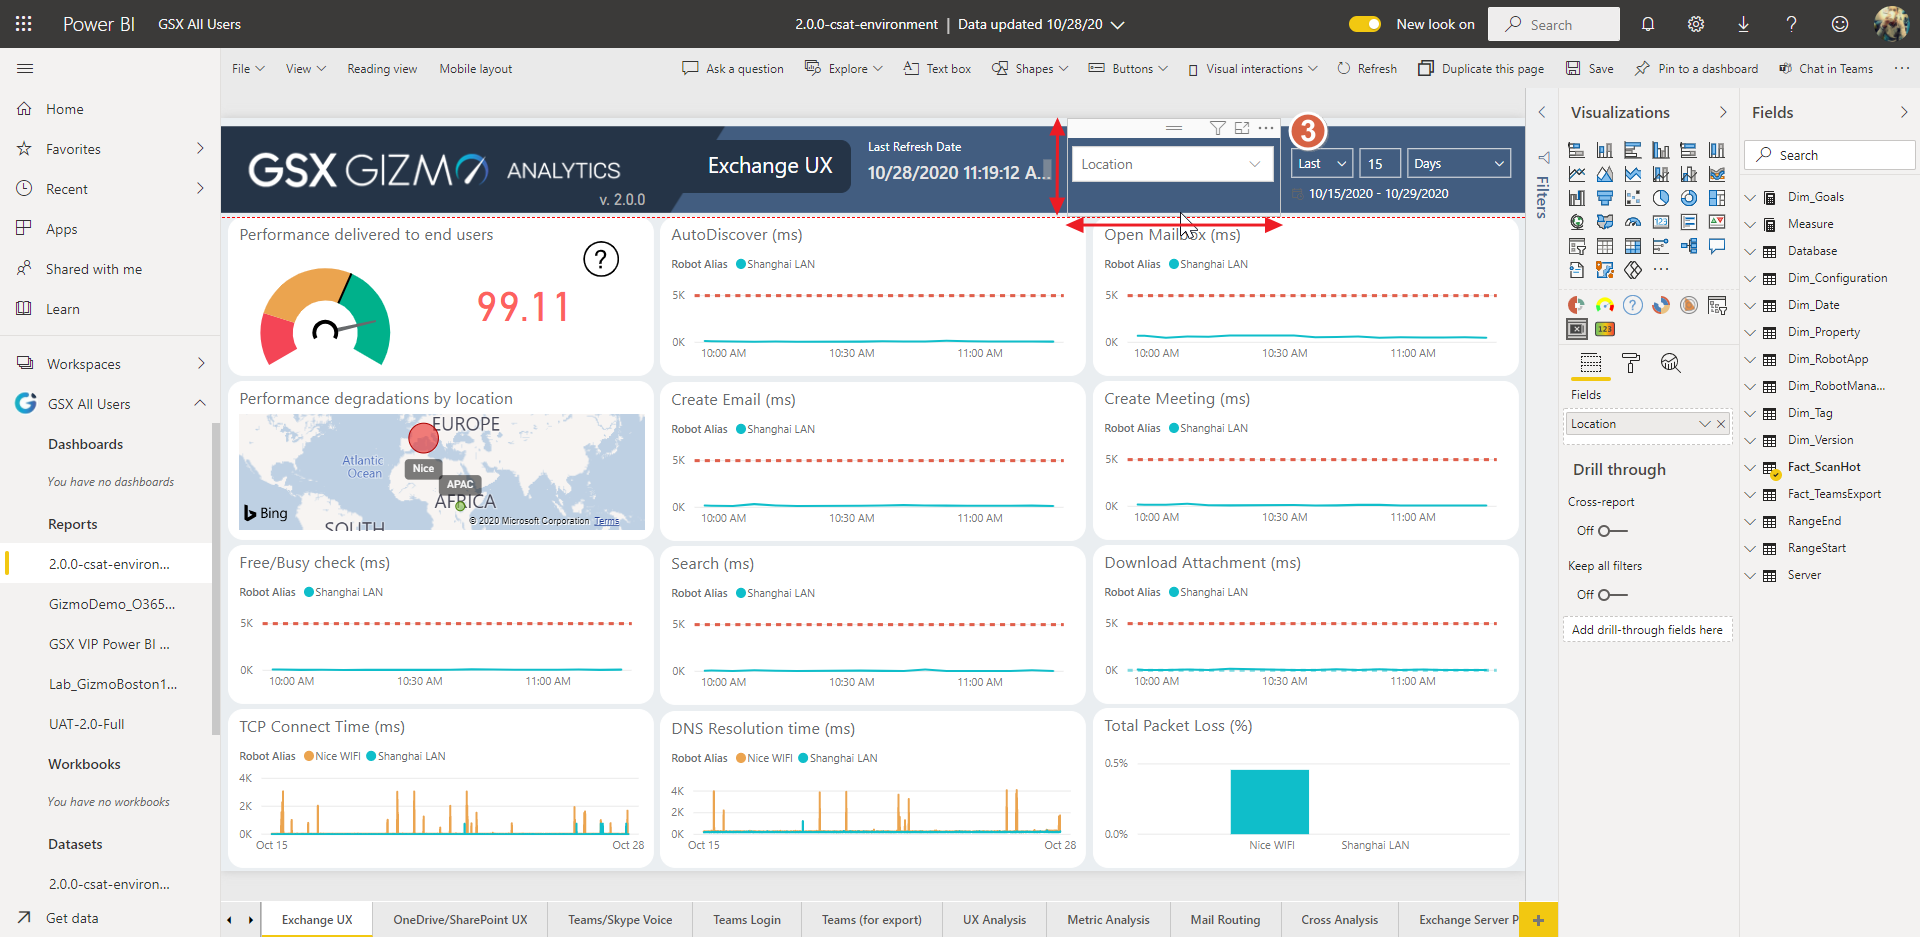
Then save and the user will be able to see the values in all graphs.